Your ceramic tableware breakage rate is the single most overlooked metric in commercial kitchen operations. Most restaurant and hotel managers know roughly how many plates they replace each month, but few calculate that number as a percentage of total inventory — and even fewer use that figure to make purchasing decisions. A breakage rate above 8% annually means you are likely overspending on replacements by 30-50% compared to well-managed operations. This article gives you a straightforward way to calculate your rate, compare it against industry benchmarks, and implement the operational and sourcing changes that actually move the number down.
What Is a Ceramic Tableware Breakage Rate and Why Track It
Breakage rate is simple math: the number of pieces broken or discarded divided by your average inventory count, expressed as a percentage over a defined period. Most operators track monthly or quarterly. Annualizing the figure gives you a clearer picture for budgeting and supplier negotiations.
Why bother? Because replacement cost is not just the price of a new plate. You pay shipping, customs clearance, inland freight, storage labor, and the administrative time to place and track reorders. For imported ceramic, a $5 plate can easily carry $2-3 in replacement logistics. When breakage is high, some operators over-order safety stock, tying up working capital in inventory that sits unused.
Tracking breakage rate also reveals patterns. A spike after introducing a new dishwasher model tells you the equipment settings are too aggressive. A steady climb three months after switching suppliers tells you the product specification changed. Without the metric, you are guessing.
How to Calculate Your Breakage Rate
The standard formula works for any operation size:
Breakage Rate = (Pieces Broken in Period / Average Inventory Count) x 100
Average inventory count is the midpoint between your starting and ending inventory for the period. If you started the quarter with 800 dinner plates and ended with 760 after replacements, your average is 780. If you broke 42 plates during that quarter, your quarterly breakage rate is 5.4%. Annualized, that is roughly 21.6% — well above acceptable levels for most operations.
For multi-location operations, calculate per location first. A hotel with three outlets — fine dining, all-day cafe, and banquet kitchen — should track each separately. The cafe typically sees higher breakage than fine dining due to faster turnover and less careful handling. Combining them masks the real problem.
Breakage Rate Benchmarks by Operation Type
Use the table below to benchmark your operation. These ranges are drawn from industry discussions with foodservice distributors and institutional buyers. Your exact figures will vary based on handling protocols, equipment, and product quality.
| Operation Type | Acceptable Annual Rate | Warning Zone | Critical Zone |
|---|---|---|---|
| Fine dining / hotel | 2-4% | 5-7% | 8%+ |
| Casual / fast-casual | 4-6% | 7-10% | 12%+ |
| Buffet / cafeteria | 5-8% | 9-12% | 15%+ |
| Catering / off-site | 6-10% | 11-15% | 18%+ |
| Bar / lounge | 3-5% | 6-8% | 10%+ |
If your rate sits in the warning zone, you can usually fix it with operational changes. If it is critical, you likely have a combination of poor product quality and bad handling practices — both need attention.
The Five Real Causes of Ceramic Breakage
Most operators blame clumsy staff or cheap product. In reality, breakage usually stems from a combination of factors. Here are the five most common root causes we see when auditing commercial kitchens.
1. Thermal Shock from Dishwasher-to-Service Transition
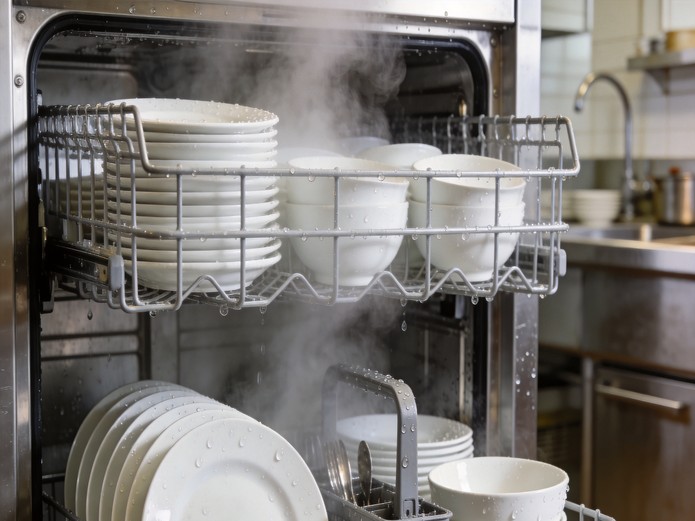
Plates come out of a high-temp dishwasher at 70-80°C and hit a cold prep counter or outdoor serving station. Rapid temperature change creates micro-cracks that weaken the piece. Those cracks do not show immediately, but the plate chips or cracks completely within days or weeks. The breakage is recorded as “random” when it is actually predictable.
2. Improper Stacking and Rack Loading
Stacking plates more than 12-15 high creates edge pressure that chips rims over time. Loading racks with plates touching metal rails or other dish types causes abrasion. Many kitchens use universal racks designed for mixed materials — a ceramic plate rubbing against a stainless steel pan in the same rack will show wear within weeks.
3. Inadequate Edge and Foot Ring Design
Not all ceramic is equal. Plates with thin, flat rims chip faster than those with slightly rounded or reinforced edges. Foot rings — the unglazed ring on the bottom — are common failure points. A narrow foot ring concentrates weight on a small contact area, increasing stress during stacking. Wide, well-fired foot rings distribute load better.
4. High-Temperature Conveyor Dishwashers
Commercial dishwashers running above 82°C accelerate glaze degradation and thermal fatigue. Over 18-24 months, this can increase breakage rates by 20-40% compared to low-temp chemical sanitizing units. The damage is gradual: glaze crazing appears first, then structural failure follows.
5. Staff Handling Without Defined Protocols
In busy kitchens, staff carry four plates per hand, slide plates across counters, and drop them into bus tubs from waist height. None of these practices are malicious — they are habits formed under time pressure. Without explicit handling protocols and regular reminders, breakage accumulates.
How to Reduce Breakage Through Operational Changes
Operational fixes cost little or nothing and often deliver the biggest improvement. Here are three changes that consistently reduce commercial kitchen plate breakage by 25-40% when implemented together.
Change 1: Introduce a cooling buffer zone. Allow plates to rest in an ambient-temperature area for 3-5 minutes after dishwasher exit before moving them to cold storage or outdoor service stations. If space is tight, use a rolling cart as a transition zone. This single change eliminates most thermal-shock-related failure.
Change 2: Cap stack height and separate materials in racks. Limit ceramic stacks to 12 plates. Use rack dividers or dedicated ceramic racks to prevent metal-on-ceramic contact. Label racks clearly so staff do not mix materials. The cost of a few extra racks is recovered within one reorder cycle.
Change 3: Define and train handling standards. Create a one-page standard: two plates per hand maximum, no sliding on counters, plates placed — not dropped — into bus tubs. Post it in the dish room and review it during pre-shift briefings for two weeks. Most breakage reduction happens in the first month after training.
How Product Design Affects Breakage Risk
If operational changes do not move your rate below the warning zone, your product specification may be the issue. Here is what to look for when selecting ceramic for high-breakage environments.
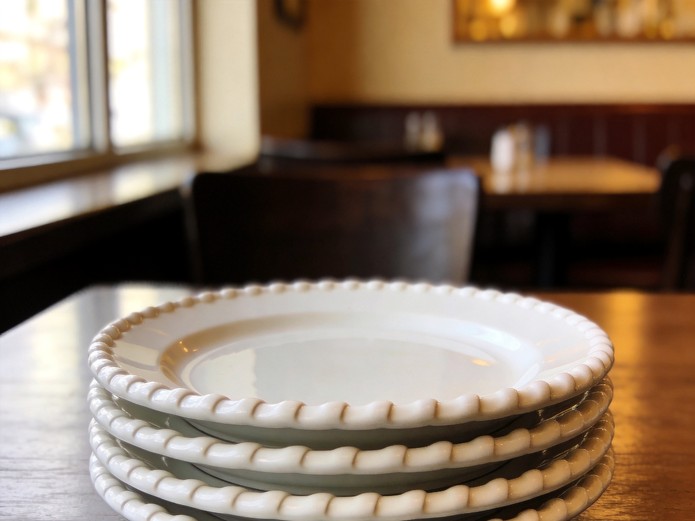
Edge profile: Rounded or “rolled” edges resist chipping better than sharp, flat rims. The rounded edge distributes impact force across a larger area. For buffet and cafeteria service, specify rolled edges explicitly.
Body thickness: Thicker walls absorb impact better, but they also add weight and shipping cost. For most commercial operations, a wall thickness of 5-7 mm strikes the right balance. Thinner walls (under 4 mm) are fine for fine dining with gentle handling but risky for high-turnover service.
Glaze hardness: Harder glazes resist surface abrasion but can be more brittle. Softer glazes are more forgiving of impact but scratch more easily. For commercial dishwashers, a glaze hardness of 6-7 on the Mohs scale is the practical sweet spot. Request glaze hardness data from your supplier — not all factories test this, but reputable ones will.
Foot ring width: A foot ring width of 8-12 mm provides stable stacking support without concentrating load. Narrow foot rings (under 5 mm) are common on low-cost plates and are a frequent failure point.
When High Breakage Signals a Supplier Problem
Sometimes the problem is not your kitchen — it is the product. Here are three warning signs that point to manufacturing defects rather than handling issues.
Sign 1: Breakage clusters around specific SKUs. If 70% of your breakage comes from one plate size or one glaze color while other pieces from the same order hold up fine, the issue is likely a firing defect or glaze mismatch on that specific production run.
Sign 2: Breakage occurs within the first 30 days. New ceramic should not fail in the first month under normal use. If it does, the piece was likely under-fired or had pre-existing stress cracks from rapid cooling after kiln exit.
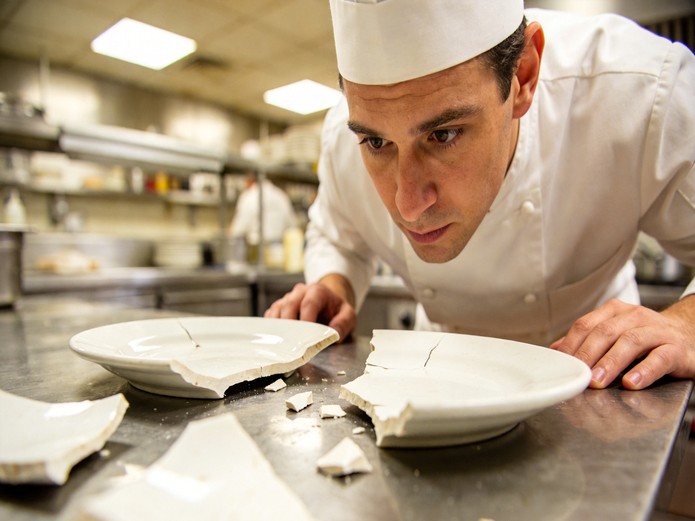
Sign 3: Breakage pattern is radial cracking from the center. This pattern usually indicates insufficient kiln support during firing or a body formulation issue. Edge chips are normal wear. Center cracks are not.
If you see these signs, document them with photos and request a replacement credit or defect investigation from your supplier. Reputable suppliers will ask for failure samples to analyze. If your supplier refuses or dismisses the concern, that is a signal to evaluate alternatives.
Ceramic Tableware Breakage Prevention Checklist
Copy this checklist for your next operational review or supplier evaluation:
- Calculate breakage rate for the last quarter and annualize it
- Benchmark your rate against the table above by operation type
- Audit dishwasher temperature settings — confirm they match manufacturer specs for ceramic
- Inspect stacks and rack loading during peak service
- Check for thermal shock patterns — breakage within 48 hours of dishwashing
- Review edge and foot ring design on your current pieces
- Identify if breakage clusters around specific SKUs or production batches
- Confirm staff have been trained on handling protocols within the last 6 months
- Request glaze hardness and thermal shock test data from your supplier
- Negotiate replacement credits for breakage above 5% in the first 90 days
- Plan safety stock at 15-20% above normal usage, not 50%+
Cost, Quality, and Lead Time Trade-Offs
Reducing breakage usually involves spending slightly more per piece upfront. Here is how the trade-off works in practice.
A standard ceramic dinner plate at $4.50 with a 12% annual breakage rate costs you $0.54 per year in replacement. A reinforced plate at $6.00 with a 4% breakage rate costs $0.24 per year. Over three years, the “expensive” plate saves $0.90 per piece in replacement cost alone — before you count reduced shipping, labor, and inventory carrying cost.
The catch is lead time. Reinforced commercial ceramic with custom edge profiles typically adds 2-3 weeks to production and may require higher MOQs — often 1,000-2,000 pieces per SKU versus 500-800 for standard shapes. If you need stock urgently, standard pieces with operational fixes may be the better short-term choice while you plan a specification upgrade for the next order cycle.
For operations reordering every 8-12 weeks, the lead time difference is manageable. For operations that only reorder annually, getting the specification right on the first order matters more.
FAQ
What is a normal breakage rate for restaurant ceramic plates?
For fine dining, 2-4% annually is normal. Casual restaurants typically see 4-6%. Buffets and cafeterias run 5-8%. Catering operations see the highest rates at 6-10% due to transport and off-site handling. If your rate exceeds these ranges, investigate root causes before reordering.
Can I negotiate with my supplier for breakage-related replacements?
Yes. Most reputable suppliers will offer replacement credits for defects documented within 30-90 days. For operational breakage, some suppliers offer breakage allowance programs — typically 2-3% of order value — as a goodwill gesture on large orders. Ask before you place your next order, not after breakage occurs.
Does dishwasher detergent affect ceramic durability?
Aggressive alkaline detergents accelerate glaze degradation over time, which indirectly increases breakage by weakening the surface. Switching to a milder detergent formulated for ceramic and porcelain can extend service life by 15-25%. Check with your chemical supplier for ceramic-safe formulations.
Should I track breakage by individual SKU or by category?
Track by SKU if you have fewer than 20 active pieces. It reveals specific product problems quickly. For larger operations with 50+ SKUs, track by category (dinner plates, bowls, mugs) to keep the workload manageable, then drill down when a category shows unusual numbers.
How much safety stock should I carry to cover breakage?
15-20% above normal usage is sufficient for most operations with stable breakage rates. Carrying 50% or more safety stock ties up working capital and creates storage problems. If your breakage is so high that you need 50% safety stock, fix the breakage problem first.
Is vitrified ceramic worth the extra cost for high-breakage environments?
Usually yes. Vitrified ceramic has near-zero water absorption, making it more resistant to thermal shock and edge chipping. The unit cost is 20-40% higher than standard stoneware, but the lifespan in commercial use is typically 30-50% longer. Run your own cost-per-use calculation before deciding.
Need a structured way to evaluate your current ceramic quality? Download the ceramic QC checklist — it covers the exact tests and standards to verify before your next order ships.