Ceramic tableware total cost of ownership (TCO) is the single most important metric that B2B buyers overlook when sourcing dinnerware for their business. Most procurement teams focus exclusively on the FOB unit price printed on a supplier quotation, assuming that the cheapest option delivers the best value. But this approach ignores ceramic tableware total cost of ownership entirely. In reality, the initial purchase price typically represents only 30–40% of the true cost of owning ceramic tableware over its full lifecycle. Shipping fees, breakage rates, replacement cycles, storage expenses, and maintenance costs all accumulate to create a total financial burden that far exceeds the sticker price. Understanding ceramic tableware total cost of ownership is not just an accounting exercise — it is a strategic framework that separates profitable sourcing decisions from costly mistakes that drain budgets for years. Whether you are sourcing for a hotel chain, restaurant group, catering business, or retail operation, understanding and optimizing ceramic tableware total cost of ownership will transform how you evaluate suppliers, compare products, and build your tableware inventory for maximum long-term value.
What Is Ceramic Tableware Total Cost of Ownership?
Ceramic tableware total cost of ownership is a comprehensive financial calculation that accounts for every expense associated with sourcing, receiving, storing, using, maintaining, and replacing dinnerware products throughout their usable life. Unlike unit price comparisons that only consider the initial purchase cost, TCO analysis captures the full economic impact of a tableware investment, enabling buyers to make apples-to-apples comparisons between different suppliers, materials, and quality tiers.
A complete ceramic tableware total cost of ownership analysis includes six major cost categories:
- Purchase cost: The unit price multiplied by order quantity, including tooling fees and customization charges
- Shipping and logistics: Freight, insurance, customs duties, port fees, and last-mile delivery
- Breakage and loss: The cost of replacing items damaged in transit or during normal use
- Storage and handling: Warehouse space, shelving, inventory carrying costs, and labor
- Maintenance: Dishwashing chemicals, energy, labor, and periodic refurbishment
- Replacement cycle cost: The annualized cost of replenishing worn or damaged inventory
For B2B buyers, the most valuable insight from ceramic tableware total cost of ownership analysis is often this: a slightly more expensive product with lower breakage rates and longer lifespan almost always delivers a lower ceramic tableware total cost of ownership than the cheapest available option. This is why premium porcelain, despite its higher upfront price, frequently outperforms budget stoneware on a five-year TCO basis.
Purchase Price and Ceramic Tableware Total Cost of Ownership
The purchase price of ceramic tableware is the most visible cost component and the one that receives the most attention during supplier negotiations. However, it is rarely the largest contributor to total cost of ownership, especially for high-volume commercial operations. Understanding what drives the purchase price — and what it does and does not include — is the first step in accurate ceramic tableware total cost of ownership calculation.
Factors That Determine Purchase Price
- Material type: Bone china is the most expensive, followed by fine porcelain, standard porcelain, stoneware, and earthenware
- Production method: Hand-painted and hand-thrown pieces cost significantly more than slip-cast or machine-pressed items
- Decoration complexity: Full-wrap decals, gold/silver rim lines, and multi-color prints add 20–50% to unit cost
- Order quantity: MOQ pricing tiers can create 15–30% price differences between small and large orders
- Customization: Custom shapes, custom glazes, and logo printing all carry separate tooling and setup fees
Buyers should be aware that the lowest quoted price often excludes critical services that you will pay for separately. For example, some factories quote ex-works pricing that does not include transport to the port, quality inspection fees, or export documentation. Always confirm whether the quoted price is FOB, EXW, or CIF, and factor in the missing costs to get a true apples-to-apples comparison.
For a detailed breakdown of pricing structures and Incoterms, refer to our ceramic shipping costs and Incoterms guide, which explains FOB, CIF, and DDP pricing in full detail.
Shipping Costs and Ceramic Tableware Total Cost of Ownership
Shipping and logistics represent the second-largest cost component in ceramic tableware total cost of ownership — a fact that surprises many buyers new to TCO analysis, and in some cases can equal or exceed the FOB purchase price. Ceramic products are heavy, fragile, and bulky, making them expensive to transport internationally. Buyers who only compare unit prices without accounting for shipping costs can be caught off guard by the final landed cost of their shipment.
Key Logistics Cost Components
- Ocean freight: A 20-foot container of ceramic tableware typically costs $1,500–$4,000 depending on the route and season
- Insurance: Cargo insurance generally runs 0.2–0.5% of the shipment value
- Customs duties: Ceramic tableware import duties range from 0% to 25% depending on the destination country and product classification
- Port and handling fees: Terminal handling charges, documentation fees, and customs clearance services
- Inland transportation: Trucking from the port to your warehouse or distribution center
- Last-mile delivery: Distributing inventory to individual store locations or customer addresses
The weight and volume of ceramic tableware directly influence shipping costs. A typical 20-foot container can hold approximately 15,000–25,000 pieces of tableware depending on size and packaging. Denser, heavier items like thick stoneware plates will have a higher per-unit shipping cost than lightweight porcelain bowls. When comparing products, always calculate the shipping cost per unit rather than looking at total freight alone.
Seasonal fluctuations also matter. Ocean freight rates can spike by 50–200% during peak shipping seasons (August–October for holiday goods). Buyers who plan their sourcing calendar strategically can lock in lower rates and reduce their overall TCO. Our seasonal sourcing calendar provides a detailed month-by-month breakdown of the best times to place orders.
Breakage and Ceramic Tableware Total Cost of Ownership
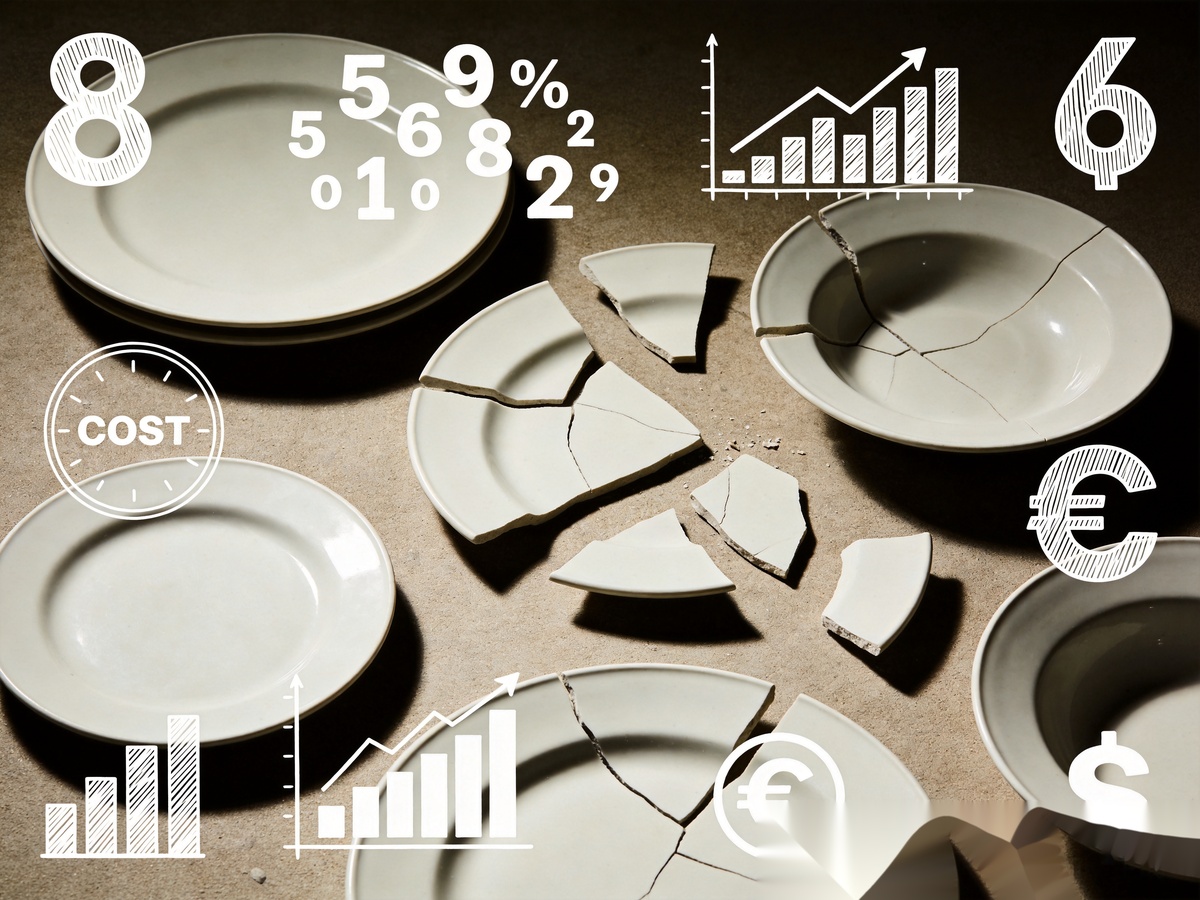
Breakage is the single most underestimated cost factor in ceramic tableware total cost of ownership, and it can single-handedly double your effective cost per piece. Unlike purchase price or shipping, which are one-time expenses, breakage creates a recurring cost that accumulates year after year for as long as you operate. A product that costs 20% less upfront but breaks twice as often will cost you significantly more over a three to five year period.
Understanding Breakage Rates by Setting
- Fine dining restaurants: 5–10% annual breakage rate (careful handling, lower volume)
- Casual dining restaurants: 15–25% annual breakage rate (higher volume, faster pace)
- Hotel banquet facilities: 20–35% annual breakage rate (high volume, frequent transport)
- Cafés and coffee shops: 10–20% annual breakage rate (mostly cups and saucers)
- Catering businesses: 25–40% annual breakage rate (frequent transport and setup)
These breakage rates translate directly into replacement costs. For a restaurant with 2,000 pieces of tableware and a 20% annual breakage rate, that means replacing 400 pieces every year. At an average replacement cost of $3 per piece, that is $1,200 per year — or $6,000 over five years — just to maintain the same inventory level. Higher quality tableware with better durability can reduce breakage rates by 30–50%, creating substantial long-term savings and reducing your overall ceramic tableware total cost of ownership.
Material choice is the primary determinant of breakage resistance. Bone china and high-fired porcelain are significantly more chip-resistant than earthenware or low-fired stoneware. Our ceramic tableware durability testing guide explains how different materials perform under real-world conditions and how to evaluate durability specifications from suppliers.
Storage Costs and Ceramic Tableware Total Cost of Ownership
Storage and handling costs are often overlooked in TCO calculations because they are embedded in broader operational expenses. However, for businesses that carry significant tableware inventory — such as hotel chains, catering companies, and retailers — these costs can be substantial and should be explicitly included in any ceramic tableware total cost of ownership analysis.
Storage Cost Components
- Warehouse space: The cost of shelf or floor space allocated to tableware storage
- Inventory carrying cost: Capital tied up in inventory that could be invested elsewhere (typically 15–25% of inventory value annually)
- Handling labor: Time spent receiving, counting, shelving, and picking tableware items
- Insurance: Property insurance covering stored inventory
- Obsolescence risk: The risk that designs go out of style before inventory is used
Stackability is a key product attribute that directly affects storage costs. Tableware that stacks efficiently requires less shelf space and reduces handling time. A set of plates that stacks 20% higher than a competing product means you can store 20% more inventory in the same space, reducing your per-unit storage cost proportionally. This is why commercial-grade tableware is specifically designed with stackability in mind — it directly lowers the ceramic tableware total cost of ownership.
For businesses operating multiple locations, centralized vs. distributed storage strategies also impact TCO. Centralized storage reduces total inventory requirements through economies of scale but increases transportation costs between locations. The optimal strategy depends on your breakage rate, turnover speed, and transportation network.
Maintenance Costs in Ceramic Tableware Total Cost of Ownership
Maintenance costs represent the ongoing expenses of keeping ceramic tableware in serviceable condition throughout its lifecycle. While these costs are often considered part of general overhead, they vary significantly between different tableware products and should be factored into ceramic tableware total cost of ownership comparisons.
Key Maintenance Cost Factors
- Dishwashing chemicals: Commercial dishwashing detergents and rinse aids represent a recurring cost that scales with usage volume
- Energy and water: Commercial dishwashers consume significant amounts of hot water and electricity per cycle
- Labor: The time spent loading, unloading, and inspecting tableware after each wash cycle
- Wear and tear: Glaze degradation, metal marking, and color fading that eventually require replacement
The quality of the glaze is a critical factor in maintenance costs. High-quality glazes resist metal marking (the gray marks caused by flatware), maintain their color through thousands of wash cycles, and do not become dull or porous over time. Cheap glazes may look good on delivery but will show wear within 6–12 months of commercial use, requiring earlier replacement and increasing the effective ceramic tableware total cost of ownership.
Microwave and dishwasher compatibility also influence maintenance costs. Tableware that is not dishwasher-safe requires hand-washing, which dramatically increases labor costs. Similarly, microwave-incompatible tableware limits operational flexibility and may require purchasing additional microwave-safe pieces. Our microwave and dishwasher safety guide explains how to verify these specifications with suppliers.
How to Calculate Ceramic Tableware Total Cost of Ownership
Calculating ceramic tableware total cost of ownership requires systematic data gathering across multiple cost categories and normalizing everything to a common basis — typically cost per piece per year, or cost per meal served. The following step-by-step framework will help you build an accurate ceramic tableware total cost of ownership model for any tableware procurement decision.
Step 1: Define Your Analysis Period
Choose a time horizon that matches your expected product lifecycle. For commercial tableware, a 3-year or 5-year analysis period is standard. Five years is recommended for high-quality commercial-grade products, while three years may be more appropriate for budget or fashion-driven lines that will be replaced sooner.
Step 2: Gather Cost Data
- Purchase cost: Unit price × quantity + tooling/customization fees
- Shipping cost: Total landed cost (freight + duties + fees) ÷ quantity
- Annual breakage cost: Quantity × breakage rate × replacement unit cost
- Annual storage cost: Storage space cost + inventory carrying cost (15–25% of inventory value)
- Annual maintenance cost: Estimated washing cost per piece × annual washes × quantity
- End-of-life value: Salvage value or disposal cost (usually zero or negative for ceramic tableware)
Step 3: Calculate Total Cost
Use this formula to calculate total cost of ownership over your analysis period:
TCO = Initial Purchase Cost + Total Shipping + (Annual Breakage Cost × Years) + (Annual Storage Cost × Years) + (Annual Maintenance Cost × Years) − End-of-Life Value
To compare products with different quantities or lifespans, normalize the result to cost per piece per year:
Cost per Piece per Year = TCO ÷ Quantity ÷ Analysis Period (Years)
Step 4: Sensitivity Analysis
Run the calculation with different assumptions to test how sensitive the result is to each variable. For example, what happens if breakage rates are 10% higher than expected? What if shipping costs increase? The products that maintain the lowest TCO across a range of scenarios are the most robust choices.
Ceramic Tableware Total Cost of Ownership Comparison: Budget vs Premium
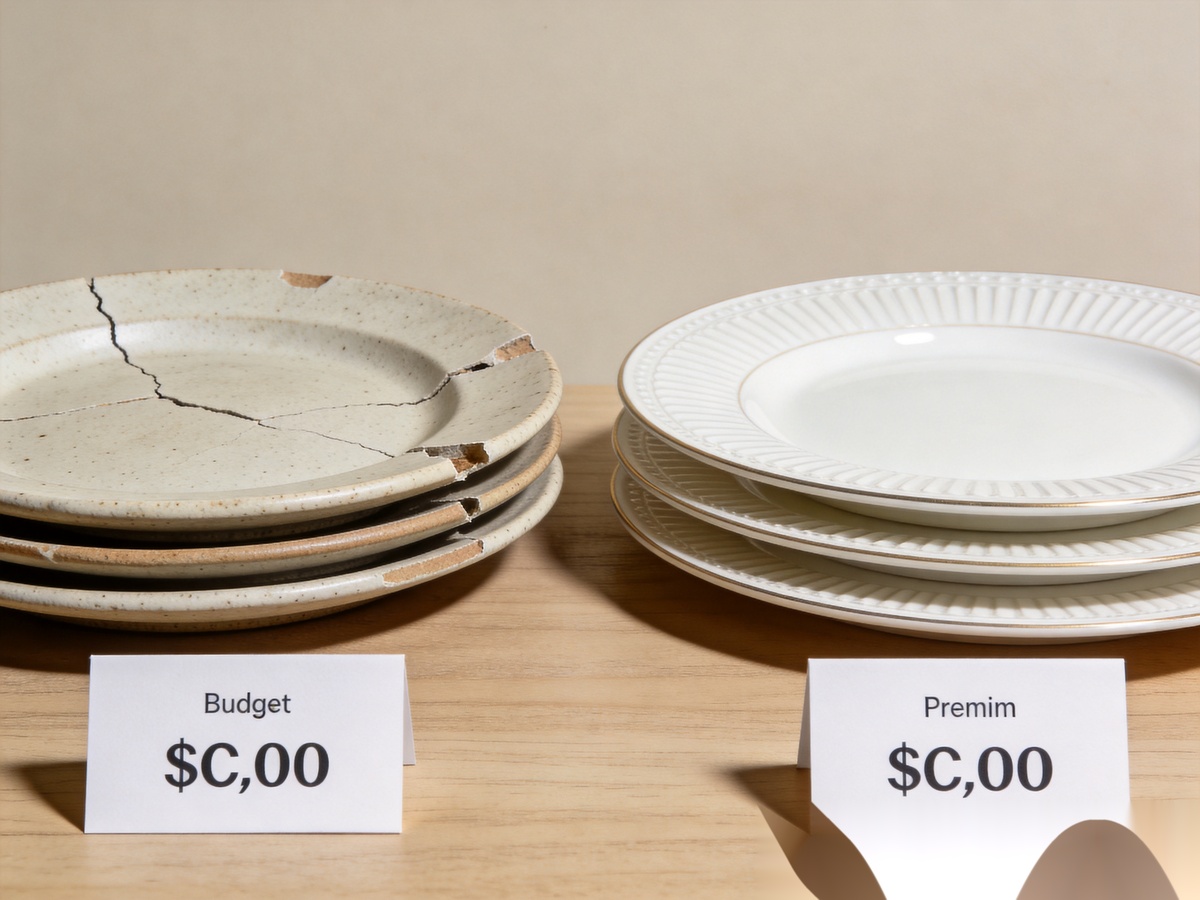
To illustrate how ceramic tableware total cost of ownership works in practice — and why it matters so much, let us compare two hypothetical dinnerware plates over a five-year period. This example uses realistic numbers based on typical commercial restaurant usage.
- Budget stoneware plate: $2.00 FOB, 25% annual breakage rate, 3-year expected lifespan
- Premium porcelain plate: $3.50 FOB, 10% annual breakage rate, 5-year expected lifespan
At first glance, the budget plate seems like the obvious choice at 43% cheaper. But let us calculate the 5-year TCO for 1,000 plates:
Budget Stoneware (5-Year TCO Calculation)
- Initial purchase: 1,000 × $2.00 = $2,000
- Shipping (landed): 1,000 × $0.80 = $800
- Replacement purchases (2.5 sets over 5 years due to breakage + lifespan): $2,000 × 1.5 = $3,000
- Replacement shipping: $800 × 1.5 = $1,200
- Annual storage: $200 × 5 = $1,000
- Annual maintenance: $300 × 5 = $1,500
- Total 5-year TCO: $9,500 ($1.90 per piece per year)
Premium Porcelain (5-Year TCO Calculation)
- Initial purchase: 1,000 × $3.50 = $3,500
- Shipping (landed): 1,000 × $0.70 = $700
- Replacement purchases (1 set over 5 years due to lower breakage): $3,500 × 0.5 = $1,750
- Replacement shipping: $700 × 0.5 = $350
- Annual storage: $180 × 5 = $900
- Annual maintenance: $250 × 5 = $1,250
- Total 5-year TCO: $8,450 ($1.69 per piece per year)
Despite costing 75% more upfront, the premium porcelain plate has an 11% lower ceramic tableware total cost of ownership over five years. And this gap widens further when you consider that premium porcelain also enhances the customer experience, supports higher menu prices, and reduces the operational disruption of frequent replacements. This is the power of ceramic tableware total cost of ownership analysis — it reveals the true economic value of quality beyond the initial price tag.
Strategies to Reduce Ceramic Tableware Total Cost of Ownership
Now that you understand what drives ceramic tableware total cost of ownership in detail, here are proven strategies to reduce it without compromising on quality or brand experience.
1. Invest in Durability
As our TCO comparison demonstrated, paying more upfront for durable, commercial-grade tableware almost always saves money in the long run. Prioritize products with proven chip resistance, strong glaze quality, and verified commercial dishwasher compatibility. Request breakage rate data from suppliers and ask for references from similar businesses.
2. Optimize Order Quantities
Larger order quantities reduce per-unit costs through volume discounts and more efficient container utilization. However, carrying too much inventory increases storage costs and obsolescence risk. Find the sweet spot by balancing MOQ pricing tiers with your actual consumption rate and storage capacity. Our MOQ strategy guide provides detailed frameworks for optimizing order quantities.
3. Standardize Your Product Range
Using fewer SKUs across your operation reduces inventory complexity, lowers safety stock requirements, and increases your bargaining power with suppliers. A standardized tableware program with 5–10 core SKUs that cover all service needs will have a lower TCO than a fragmented program with 30+ specialized pieces that are rarely used.
4. Implement Proper Handling Protocols
Employee training on proper handling, stacking, and washing procedures can reduce breakage rates by 20–30%. Simple measures like using plate racks, avoiding metal-on-plate contact, and following correct dishwasher loading procedures have a direct and measurable impact on ceramic tableware total cost of ownership.
5. Source Directly from Manufacturers
Working directly with ceramic factories eliminates the middleman markup that trading companies add, typically 15–30%. Factory direct sourcing also gives you better control over quality, customization, and production timelines. Learn more about the benefits in our factory direct vs trading companies comparison.
6. Plan Shipments Strategically
Avoid peak shipping seasons, consolidate orders to fill containers efficiently, and choose the right Incoterms for your situation. Shipping costs can vary by 30–50% depending on timing and routing, and these savings directly reduce your ceramic tableware total cost of ownership.
Frequently Asked Questions
Q: What is the typical lifespan of commercial ceramic tableware?
A: The lifespan of commercial ceramic tableware varies significantly by material and usage environment. High-quality porcelain typically lasts 3–5 years in busy commercial settings, while stoneware may last 2–4 years. Budget earthenware often needs replacement within 1–2 years. The actual lifespan depends on breakage rates, handling practices, and maintenance quality.
Q: How much does breakage typically cost restaurants per year?
A: Most restaurants spend 5–15% of their initial tableware investment on replacements each year. For a restaurant with $10,000 in tableware, that means $500–$1,500 annually in replacement costs. High-volume casual dining restaurants and catering businesses tend to be at the higher end of this range, while fine dining establishments typically see lower breakage rates.
Q: Is more expensive ceramic tableware always better value?
A: Not always, but usually. The key is whether the higher price corresponds to materially better durability, longer lifespan, or lower maintenance requirements. Premium products that reduce breakage rates by 30% or extend lifespan by 50% will almost always deliver a lower TCO. However, you should always verify supplier claims with actual test data, third-party certifications, or customer references before paying a premium.
Q: How do I get accurate breakage rate data from suppliers?
A: Ask suppliers for specific breakage rate data from comparable customers, request references you can contact directly, and order sample quantities for in-house testing. You can also reference our durability testing guide to learn how to evaluate breakage resistance yourself before committing to a large order. Always build a safety margin into your TCO calculations — real-world breakage is often higher than supplier estimates.
Q: Can TCO analysis help me negotiate better prices with suppliers?
A: Absolutely. Understanding the total cost of ownership gives you a stronger negotiating position because you can discuss value rather than just price. For example, if a supplier offers a higher-quality product with a 20% lower TCO, you can justify paying more upfront. Conversely, if a cheaper product has hidden costs that make it more expensive overall, you can use that analysis to negotiate discounts or quality improvements. TCO data turns subjective preferences into objective financial comparisons.
Ready to Optimize Your Ceramic Tableware TCO?
Calculating ceramic tableware total cost of ownership is the essential first step toward smarter, more profitable sourcing decisions. But you do not have to do it alone. At CeraSupply, we help B2B buyers source high-quality ceramic tableware directly from Chinese factories, with full transparency on pricing, quality specifications, and durability data.
Our team can provide detailed TCO comparisons for different product options, help you evaluate supplier proposals, and ensure you get the best total value — not just the lowest sticker price. Whether you are setting up a new restaurant, refreshing your hotel tableware program, or building a retail product line, we can tailor a solution that minimizes your ceramic tableware total cost of ownership.
Contact us on WhatsApp today for a free consultation and personalized TCO analysis for your tableware project. Browse our blog for more sourcing guides and technical insights, or explore our ceramic tableware collection to see our product range.